
"Is your VR program really hitting the mark?" It's a simple question that often proves challenging to answer—especially when:
- You’re not sure what the goal is
- You’re not sure which metrics correlate with success
- You’re not sure how to track those metrics in (and out of) VR
VR analytics provides detailed insights into every user's journey, revealing what works, where to improve, and how to optimize for better results. In this ArborXR guide, we'll cover everything you need to know about VR analytics—from setting your goals to fine-tuning your approach based on data.
What Is VR Analytics?
VR analytics gathers and analyzes data on how users interact with virtual reality environments.
This data falls into two categories:
- User Interaction Metrics: Tracks user focus, movement, and engagement to reveal behavior patterns. Examples include gaze tracking, hand gestures, time spent on activities, and navigation paths.
- Performance Metrics: Measures outcomes through completion rates, app usage, error rates, and response times. This data reveals how well users learn and perform tasks in VR, enabling targeted improvements.
While this isn’t typically what people mean when they talk about VR analytics, we’d argue that organizational impact metrics also fall under this umbrella.
"Last winter [2022], about a month after we launched our de-icing program, I got the data from Futurus that showed how many people had done a proficiency check that week — and I was shocked. I knew this would actually work, and we could go to phase two."
Kevin Marcum, Program Manager VR/AR at Delta Air Lines
When Delta Air Lines implemented VR training for aircraft deicing, analytics showed a 75% reduction in training time—from 8 hours to just 2 hours—without loss in effectiveness. This type of data helps organizations refine their VR programs, justify investments, and identify opportunities for expansion.
Why VR Analytics is Important
1. Boost User Engagement
VR analytics reveals how users interact with your virtual environment in real-time. By tracking metrics like gaze patterns and time spent in specific areas, you can identify what captivates users and where engagement drops. These insights enable targeted improvements to maintain immersion and drive meaningful interactions.
2. Spot and Fix Pain Points
VR analytics also helps you pinpoint where users struggle or disengage.
When data shows users getting stuck on tasks or lingering too long in certain areas, it often indicates unclear instructions or design issues. Identifying these friction points allows you to streamline the experience through targeted improvements.
3. Track Effectiveness and Outcomes
VR analytics allow you to measure how well users are progressing and completing tasks. If your VR experience is for training, these insights help you see if users are retaining key information and reaching learning goals. Analytics offer concrete metrics on outcomes, letting you assess success and make improvements for even better results.
How to Conduct Effective VR Analytics
1. Outline Your VR Goals and Success Metrics
There are countless metrics you could be tracking... but as any analyst knows, measuring everything leads to analysis paralysis. Instead, focus on behavioral and performance metrics that directly align with your objectives.
Review the goals you set when launching your VR program, then identify metrics that clearly demonstrate progress. For example, if you want to increase employee knowledge retention by a specific percentage, prioritize completion rates and quiz scores over metrics like gaze patterns.
2. Determine How You’ll Track Your Pre-defined VR Metrics
Once you've defined your metrics, it’s time to think about how to track them. You have plenty of options, depending on what you’re measuring.
Using a Dedicated VR MDM
If you're planning an enterprise-level VR rollout, you're likely considering an MDM platform to manage your headsets—this will streamline your device management significantly. But a good XR MDM is also essential for tracking analytics.
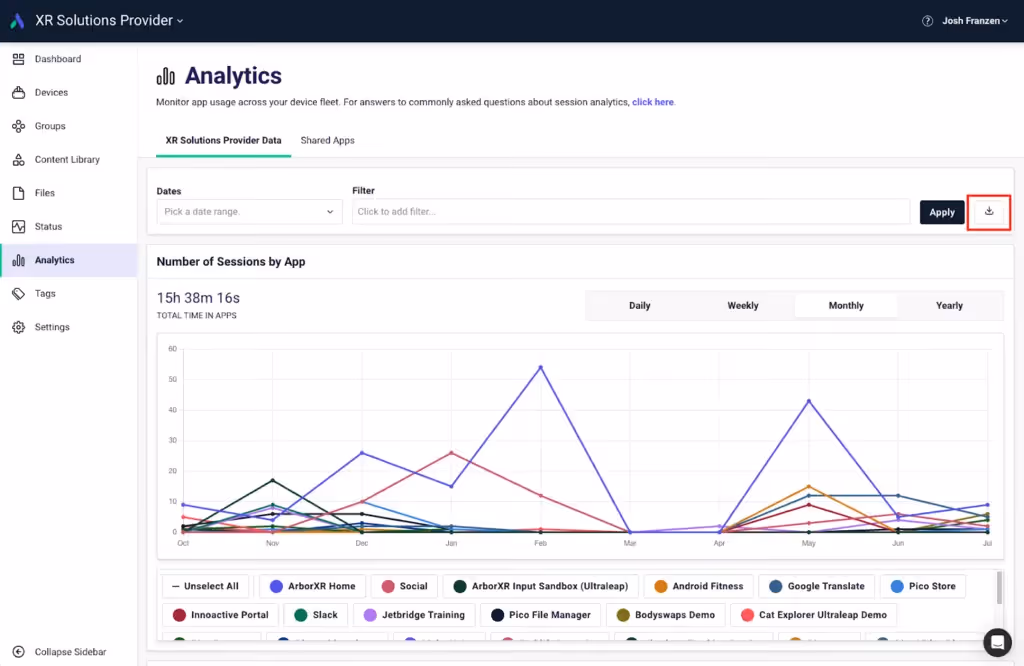
An enterprise VR MDM like ArborXR includes built-in analytics for monitoring user interactions. You can track app usage, including time spent on each app or content piece, giving you precise data on module engagement. When engagement metrics dip, it may signal the need for content updates.
ArborXR's analytics provide key features for comprehensive data collection:
- Session Tracking and Duration: ArborXR defines sessions by start and stop times, logging both active duration (actual usage) and idle duration (background running but not actively used). This helps you distinguish between real engagement and passive use.
- Offline Tracking and Data Sync: ArborXR records app usage even when devices are offline, syncing data once reconnected. This is crucial for VR programs where connectivity may vary.
- Exportable Data: You can export usage data in .csv format, filtered by date and device, for in-depth analysis and reporting.
Plus, our analytics API integrates with business intelligence tools like Tableau Cloud, Metabase, Power BI, Hex, and Deepnote for enhanced analysis.
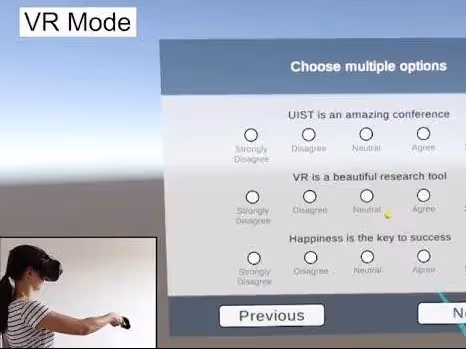
In-VR Experience Assessments
Work with your developers to integrate an analytics SDK into your app environment. For example, embedding post-experience quizzes lets you track improvements over time in an engaging, measurable way.
Looking for experienced developers to implement these features? Our XR directory connects you with vetted, enterprise-approved content developers that will work with you to create tailored, measurable VR experiences.
Plus, many offer services beyond just content creation. From ideation to measuring impact, these companies are able to guide you through the complex implementation process.
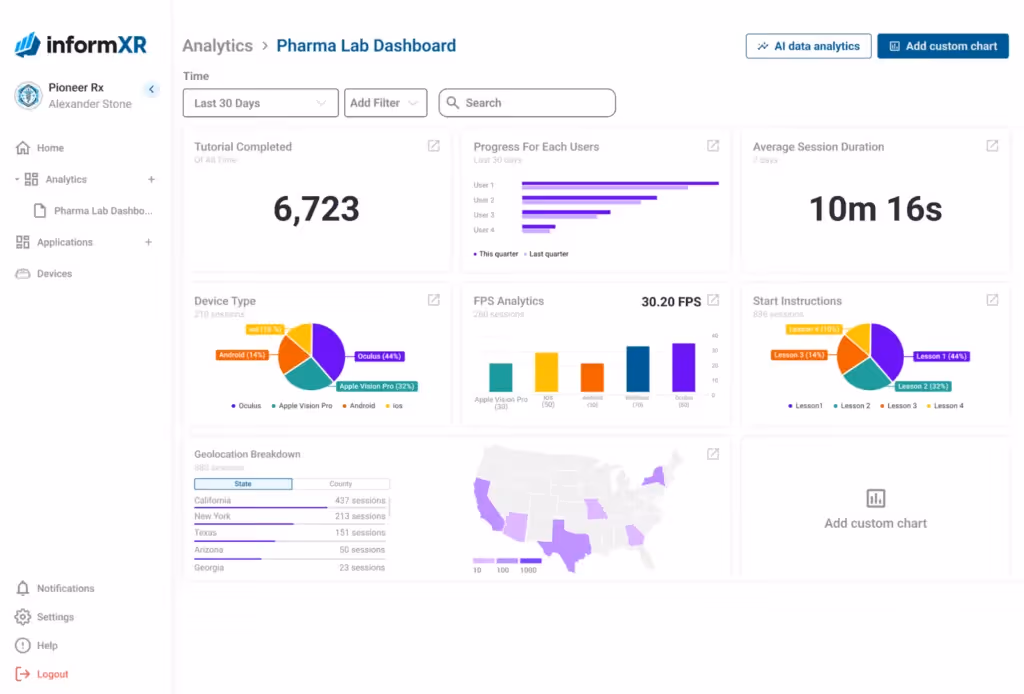
Dedicated Analytics Platforms
Finally, there are a few third-party platforms that specialize in VR analytics, like Metalitix and InformXR. These platforms focus exclusively on tracking VR-specific metrics.
Choose the tools that best support your predefined metrics.
3. Start Tracking Your VR Performance and Adjust Accordingly
Once your VR program launches, monitor your key metrics—like engagement, completion rates, and knowledge retention—against your goals. When metrics fall short, make targeted adjustments and monitor the impact.
For example, low session durations might indicate users are feeling disengaged with the content or that there are friction points you need to iron out. Solutions could include streamlining the onboarding process, clarifying instructions, or simplifying complex interactions.
Here are a few tips for tracking metrics:
- Set benchmarks: Use early data as a baseline for future comparisons.
- Look for patterns: Look for repeated behaviors, like users dropping off at specific steps.
- Monitor strategically: Monitor metrics regularly but avoid over-analyzing. For critical metrics (like completion rates or high disengagement), frequent checks are helpful to catch issues early. For less urgent trends, reviewing them biweekly or monthly can be more efficient.
Manage and Track Your VR Projects with ArborXR
VR analytics are essential for creating impactful virtual experiences, so having a plan for them is a must.
In our experience, the quickest and easiest way to handle VR analytics is through an MDM like ArborXR. ArborXR keeps track of key app usage data like session length and error rates.
But that’s not all. It also makes it easy to manage and deploy your headsets at scale, install apps and updates remotely, and even deliver multi- and single-app kiosk experiences to users.And the best part? You can start with our 30-day free trial today.