Simplify XR Learning from Login to Results
ArborXR Insights streamlines learner authentication, tracks performance, offers built-in reporting, and connects training data to your LMS and BI tools.
Trusted by 3000+ Companies worldwide


The Hidden Gaps in VR Training

Login Friction Keeps Learners Out

VR training often sits outside the learning portal learners use for everything else. People juggle new accounts, pairing codes, and vendor logins, which creates confusion, support tickets, and lower completion. Learners expect to sign in with their existing LMS credentials and launch VR from that same portal, with their identity carried into the headset.

No Visibility Into Learner Data
Once the headset goes on, teams lose visibility. There’s no easy way to know who was in the headset, if learners completed the training, how they performed, or where they struggled

VR Training Is Isolated From Existing Systems
VR data often lives in a silo, disconnected from LMS, BI, or HR tools. Teams rely on manual exports, developer workarounds, or become dependent on a single dev for reporting, slowing down workflows and limiting impact.
Over-Reliance on Content Vendors for Reporting
Content vendor dashboards and user authentication only cover their own apps, leaving teams with fragmented systems and no way to compare data across programs. If a vendor shuts down or you switch providers, your reporting breaks—and your data may be lost entirely.
Unclear What to Track or Why It Matters
There’s no established playbook for VR training metrics. Teams aren’t sure which data points matter, making insights difficult to interpret, act on, or share with leadership.
Hard to Prove ROI
Without reliable data, it's nearly impossible to justify VR training investments or compare them to traditional methods. As a result, programs stay stuck in pilot mode with no clear path to scale.

Current Solutions Are Manual, Fragmented, or Vendor-Locked
To bridge the data gap, teams resort to manual tracking, CSV exports, or custom pipelines. Others depend entirely on content vendors for reporting. These workarounds limit flexibility, don’t scale, and create bottlenecks that slow down adoption and growth.
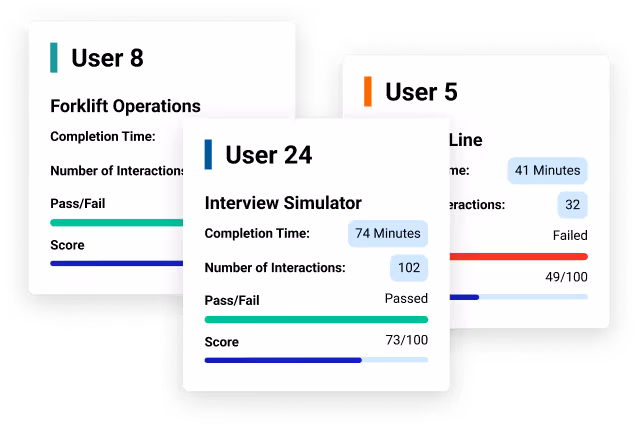
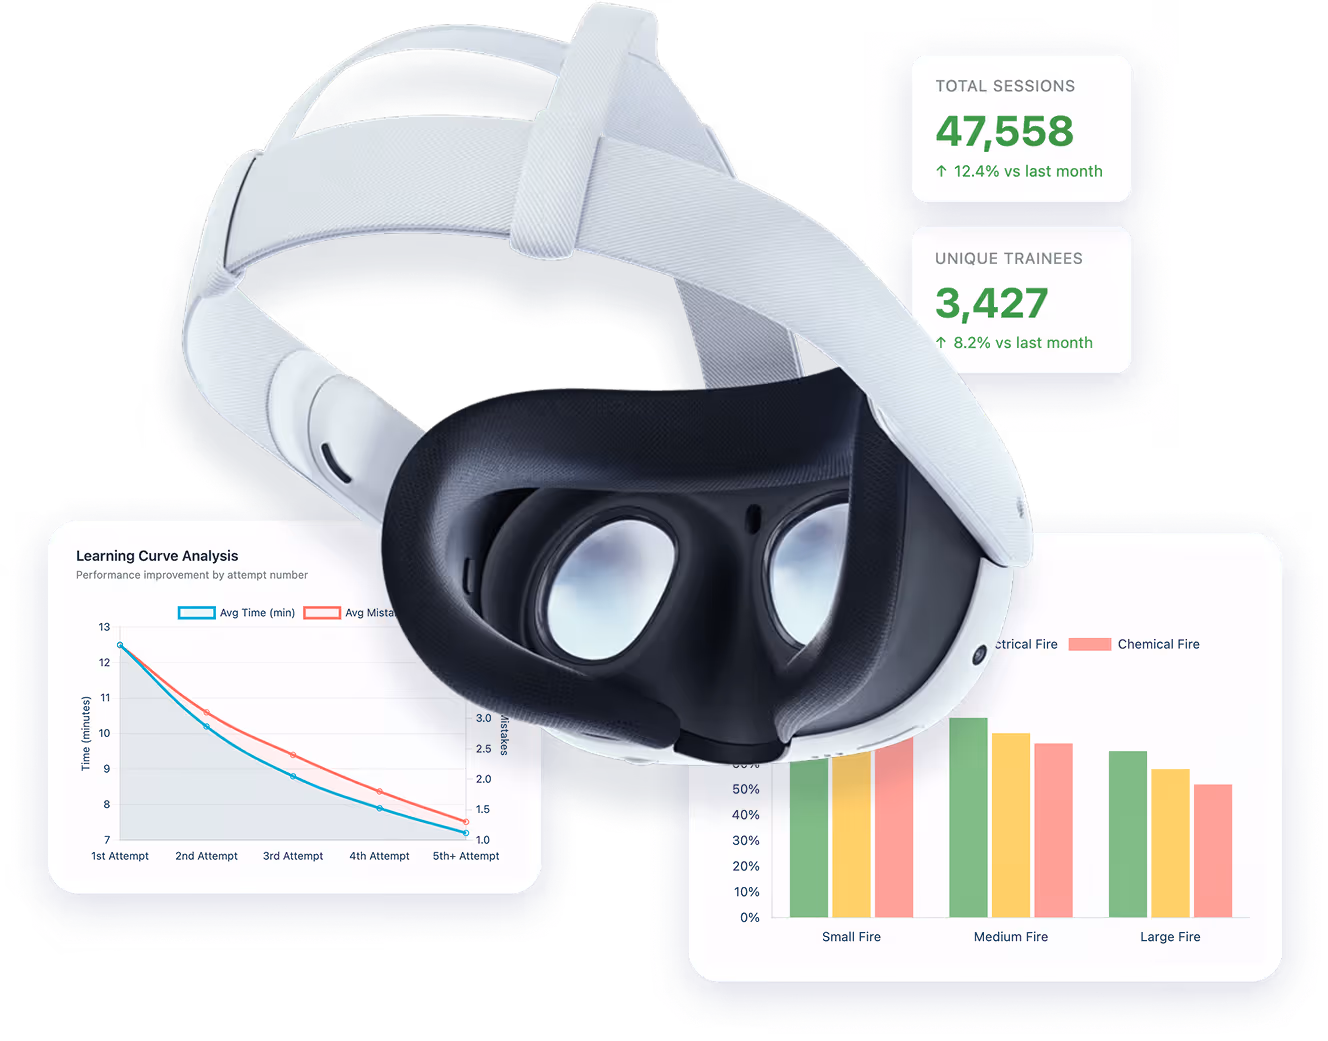
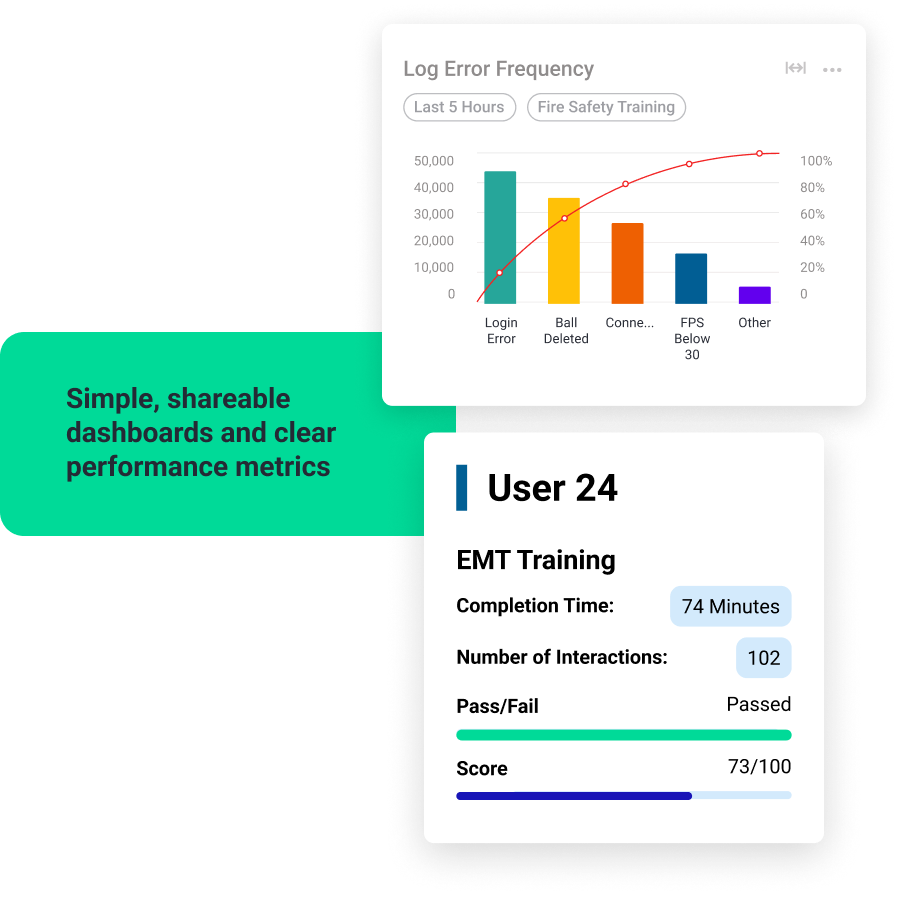
Match Performance to Users
See who’s in the headset and how they performed. Track completions, time spent, and scores across VR, AR, 360 video, and WebXR experiences.

Measure Real Learning Outcomes
Automatically log completions, performance scores, and engagement metrics.

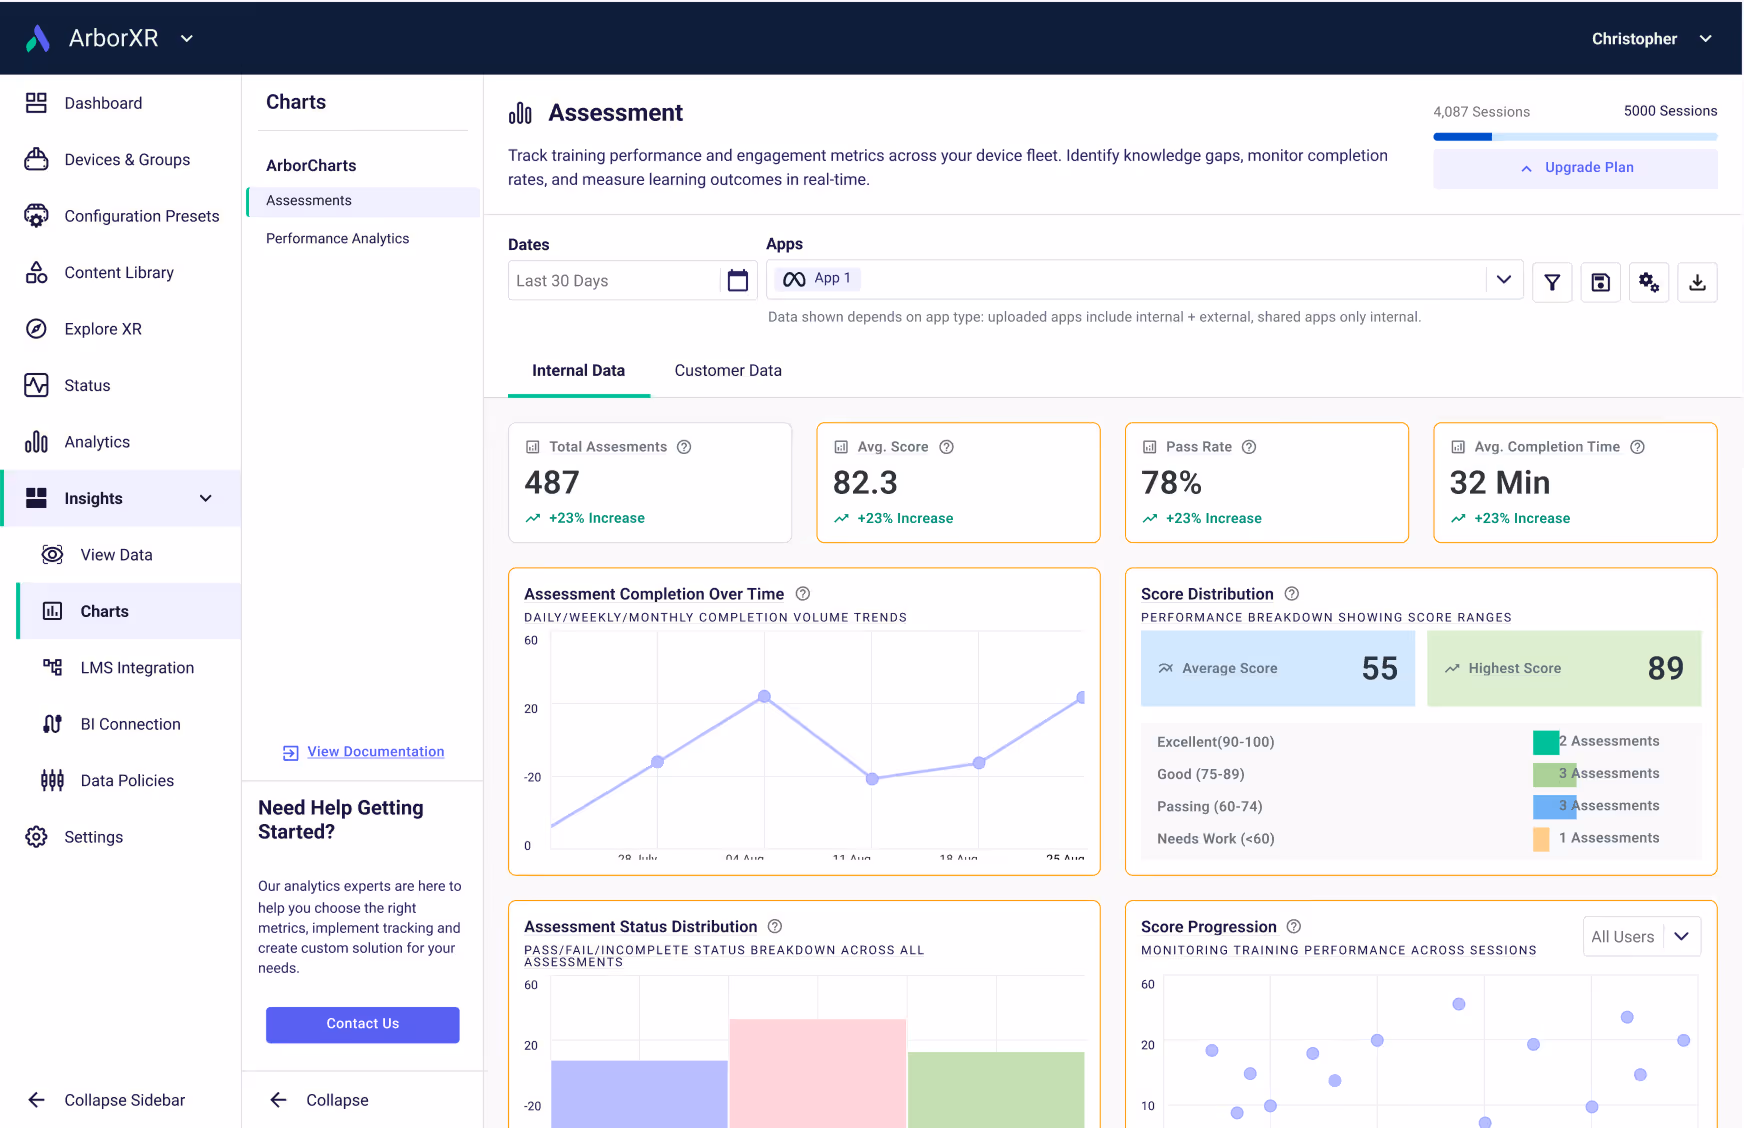
Powerful Reporting
Use built-in dashboards to measure learner outcomes and device performance. Or stream raw data into your own BI tools.
Integrate with Existing Systems
Push results into 500+ LMS, BI, and HR systems automatically. Learners launch VR modules with their existing credentials, and training data flows back without extra steps.
Simplify User Login and Authentication
Learners can login to their existing learner portal (LMS) and launch their VR experience from it.
Built for Developers
Lightweight SDKs and APIs eliminate custom pipelines. Insights handles authentication, servers, and reporting so developers can focus on content, not backend.

Enterprise Security
Built on a SOC 2 Type II and ISO 27001-compliant platform trusted by over 60 Fortune 500 companies.
How It Works
Add the SDK
Easy to understand and integrate
Capture In-Headset Data
Automatically track key learner metrics in real time.
Use Results Across Systems
Send training data to your LMS, BI tools, or other reporting environments.
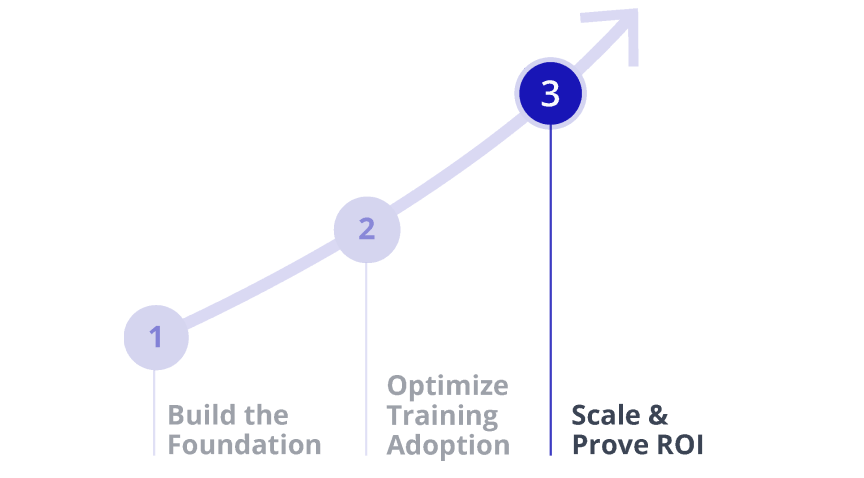
How Reliable Data Enables ROI
Once your learner data foundation is in place, Insights unlocks deeper analytics and proof of ROI.
Build the Foundation (Today)

Optimize Training Adoption
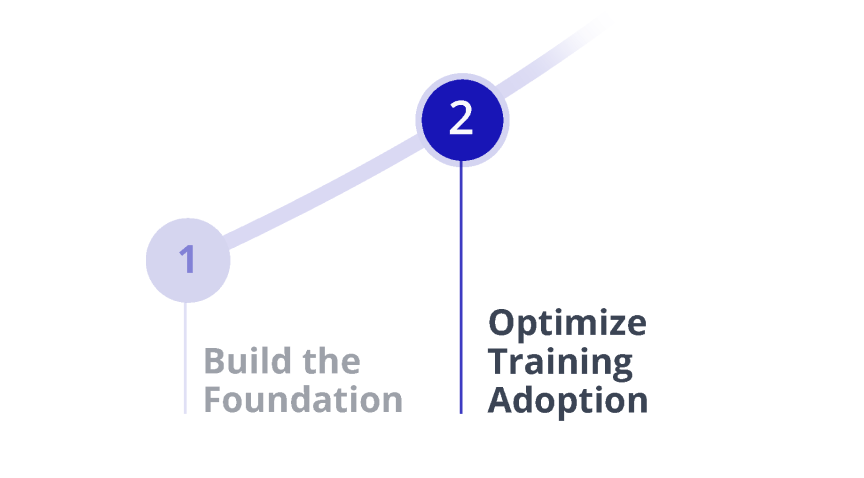
Scale & Prove ROI
organization-wide
Real Results from Real Insights Deployments
“Enterprise customers care about connecting training outcomes to the systems they already use for learning. The LMS integration piece is a big deal — it makes XR training reportable in a way that fits how organizations operate.”
“In shared classroom fleets, learner identity and timestamps make outcomes credible. Without that, analytics can’t support real instruction or reporting at scale.”
“‘Does this work with our LMS?’ is the gatekeeper question in education. With ArborXR Insights, we can meet district reporting and authentication needs without forcing schools into extra tooling or manual tracking.”
“When customers have multiple XR apps, they don’t want eight different dashboards. Insights helps bring training data into one place so educators and teams can actually use it.”
“ThingLink already captures learning analytics for both companies and educational institutions. Integrating with ArborXR Insights makes those outcomes portable - so organizations can standardize reporting across XR devices, connect results into the systems they already run training through, and prove it worked at scale.”
“For healthcare and healthcare education customers, the LMS is where training gets tracked and validated. ArborXR Insights gave us a clean path to connect XR training to the LMS and document completion and results in the systems hospitals already use.”
“The game changer for us with this particular project was ArborXR Insight’s ability to help with tracking our devices and managing content easily and seamlessly. That was a huge hurdle we needed to jump over first and ArborXR was definitely able to help with that. It will be important for us in the future to understand VR data, such as, how the applications are being used and how effective they have been.”
Who It's For
Enterprise & Education Teams

Know who trained, how they performed, and where they struggled.
Prove XR program impact with clean, shareable dashboards
Integrate with existing systems, with 500+ LMS and BI tools supported

ISVs & Content Providers
Add analytics to your product without building infrastructure
Offer LMS and BI integrations out of the box
Let customers access insights through ArborXR or your own dashboards
Developers
Eliminate backend work for tracking, reporting, and integrations
Use our SDK and API to push clean learner data to any destination
Meet compliance requirements without rebuilding your stack

What Sets Insights Apart

Learner Analytics + Device Management
The only XR platform combining enterprise MDM with in-headset analytics.

Seamless Integrations
Sync to 500+ LMS and BI tools without custom pipelines.

Enterprise-Grade Security
SOC 2 Type II and ISO 27001 certified, deployed in secure environments..

Vendor Neutral
Works with any content provider, avoiding lock-in.

Built for Scale
From pilots to global rollouts, proven in organizations with thousands of headsets.
Insights Partners
Insights-enabled content providers help make immersive training outcomes easier to track and report. Working with an ISV already? Great. Still evaluating? Browse insights-enabled partners in the ArborXR Directory.
Use Cases

Compliance &
Performance Tracking
Prove skills, certify readiness, and reduce risk.
- Track pass/fail results and scoring metrics
- Identify critical errors or risky decisions
- Monitor engagement and focus during sessions

Engagement &
Adoption Analytics
Understand how people use your experiences and keep them coming back.
- Measure session length, usage frequency, and replay rates
- Capture user sentiment and comfort levels
- Spot trends in repeat engagement

Learning Effectiveness
See what’s working, and what’s not, so training sticks.
- Track completions and quiz performance
- Assess knowledge retention over time
- Measure how often users interact with learning modules

Content Optimization
Give creators the data they need to build better experiences.
- Identify drop-off points and areas of confusion
- Measure engagement by duration and frequency
- Track where users struggle or make critical errors
Compliance &
Performance Tracking
Prove skills, certify readiness, and reduce risk.
- Track pass/fail results and scoring metrics
- Identify critical errors or risky decisions
- Monitor engagement and focus during sessions
Engagement &
Adoption Analytics
Understand how people use your experiences and keep them coming back.
- Measure session length, usage frequency, and replay rates
- Capture user sentiment and comfort levels
- Spot trends in repeat engagement
Learning Effectiveness
See what’s working, and what’s not, so training sticks.
- Track completions and quiz performance
- Assess knowledge retention over time
- Measure how often users interact with learning modules
Content Optimization
Give creators the data they need to build better experiences.
- Identify drop-off points and areas of confusion
- Measure engagement by duration and frequency
- Track where users struggle or make critical errors
Measure XR Training Like Never Before


Developer Hub
Lightweight SDKs and APIs make it easy to add analytics without building backend systems.
- Unity/Unreal SDK and WebXR Library ready to use
- Simple LMS setup with SCORM or LTI.
- Stream raw data into your own dashboards with secure APIs.
- Track completions, scores, and time-in-module with a single line of code.
- Log custom events (e.g. “Equipment_PickedUp” or “Assessment_Passed”) to capture exactly what matters in training.
Get Started
Stop guessing. Start proving.
Explore Insights today and unlock the data your XR program was built to deliver.
