Finally, Measure the Outcome of Every XR Training Session

Finally See XR Training Outcomes Where You Already Train

Get crystal-clear visibility into headset usage, completion rates, and progress metrics, all integrated seamlessly into your ArborXR dashboard.
Bring XR training data into your LMS, BI tools, and existing workflows automatically. No more manual CSV exports, separate logins, or disconnected reporting.
Computer monitor displaying an ArborXR dashboard with assessment metrics including total assessments, average score, pass rate, score distribution, training duration vs performance score chart, and a user report showing completion time, interactions, pass/fail status, and score.

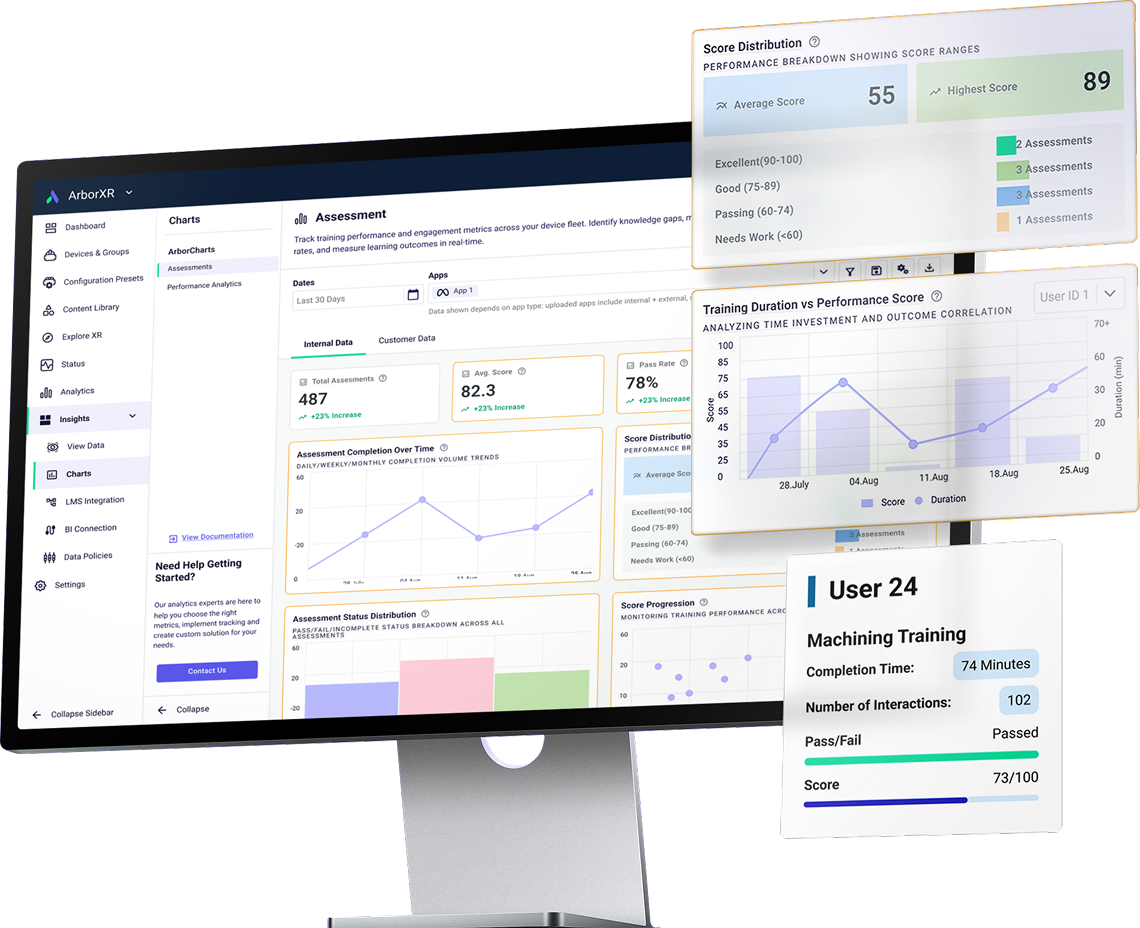
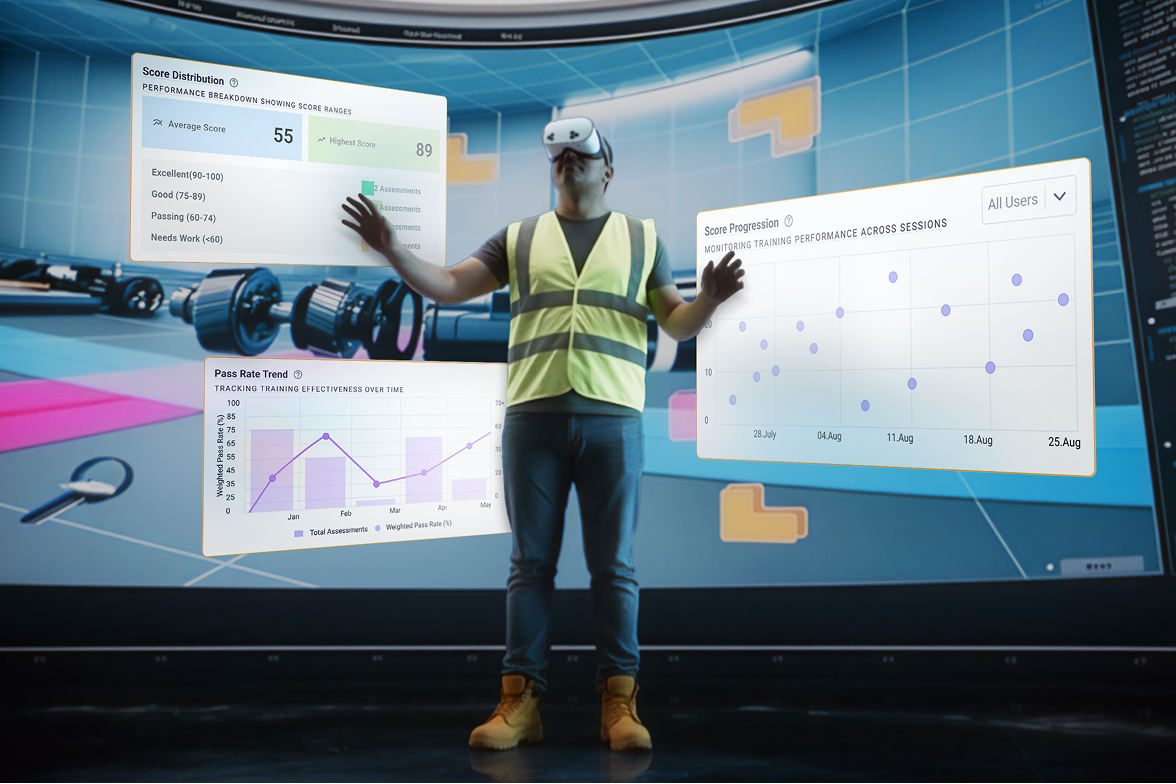
See Exactly How Learners Perform

Integrate XR Training Data with Your LMS

The most effective teams in XR training use ArborXR Insights to track learner performance, session activity, and training outcomes automatically without manual input, clipboards, or spreadsheets.

The most effective teams in XR training use ArborXR Insights to track learner performance, session activity, and training outcomes automatically without manual input, clipboards, or spreadsheets.

Left-pointing black arrow icon.
Claim Your Early Access Spot

Trusted by 3000+ Companies Worldwide

Integrate XR Training Data with Your LMS

Integrate XR Training Data with Your LMS

The most effective teams in XR training use ArborXR Insights to track learner performance, session activity, and training outcomes automatically without manual input, clipboards, or spreadsheets.

The most effective teams in XR training use ArborXR Insights to track learner performance, session activity, and training outcomes automatically without manual input, clipboards, or spreadsheets.

Left-pointing black arrow icon.
Claim Your Early Access Spot

Trusted by 3000+ Companies Worldwide

You can't manage what you can't see

Most teams struggle with inconsistent tracking, lack of visibility into learner performance, and manual processes that can’t scale.

Icon of an eye with a cross inside, symbolizing a visual blind spot.
Icon of a document with a download arrow on top left and an upload arrow at the bottom.

Performance Blindspots

Manual Burden

No visibility into who completes training or how they perform
CSVs, downloads, and manual uploads that waste time
Blue icon of ROI letters inside a speech bubble with a question mark in a smaller bubble overlapping it.
Blue arrow forming a loop with an 'X' in a circle indicating a workflow disruption.

Unproven Impact

Workflow Disruption

Impossible to demonstrate ROI to key stakeholders
Separate logins for XR and LMS systems
Blue icon depicting three squares connected by lines in a fragmented arrangement.
Blue icon of a database with a question mark in a circle above it.

System Fragmentation

Data Gaps

VR data remains disconnected from existing learning infrastructure
XR data isolated from other learning metrics

Everything You Need to See, All in One View.

Your XR Data Flowing Seamlessly Into Your LMS

ArborXR Insights delivers your XR data right into your workflow.

ArborXR Insights delivers your XR data right into your workflow.

ArborXR Assessment dashboard showing total assessments (487), average score (82.3), pass rate (78%), and average completion time (32 minutes) with charts for completion over time, score distribution, assessment status distribution, and score progression.
Dashboard showing fire safety training metrics: average session time 10m 16s, total sessions 200, FPS control line graph with times, assessment completion pie chart 55% in progress, and user performance cards for User 5, User 8, and User 24 with completion times, interactions, pass/fail status, and scores.
Blue virtual reality headset icon with an information symbol below it.
Blue icon of an upward trending line graph connected to three nodes below.
See how every headset is performing.
XR metrics flow directly into your LMS and analytics dashboards.
Magnifying glass with interconnected nodes representing tracking value.
Icon of three stacked documents with a crossed wrench and screwdriver symbol.
Track which experiences drive the most value.
Eliminate exports, uploads, and duplicate data entry.
Icon representing a dashboard with a layout of a rectangle and three horizontal lines on the right.
Icon of a user profile with progress bars beneath it.
Understand usage duration, frequency, and patterns.
Give L&D and leadership real-time visibility into learner progress.
Blue icon of stacked database disks with a checkmark indicating actionable data.
Blue icon depicting a bar chart alongside a pie chart within a rounded square.
Empower every XR champion with data they can act on.
Training results appear in the same dashboards and reports you already use.

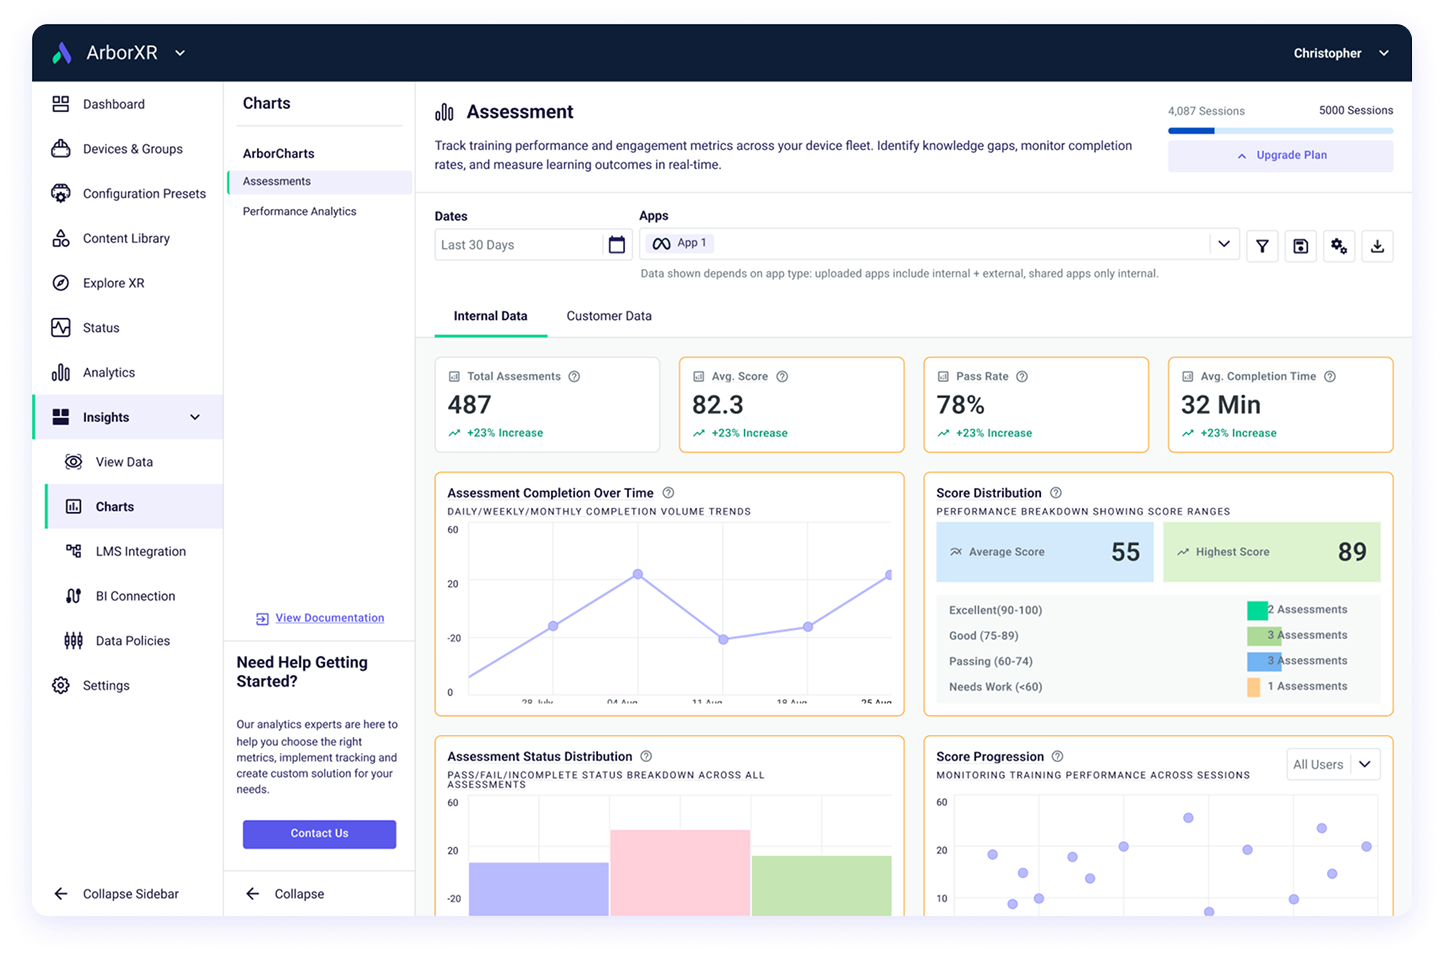
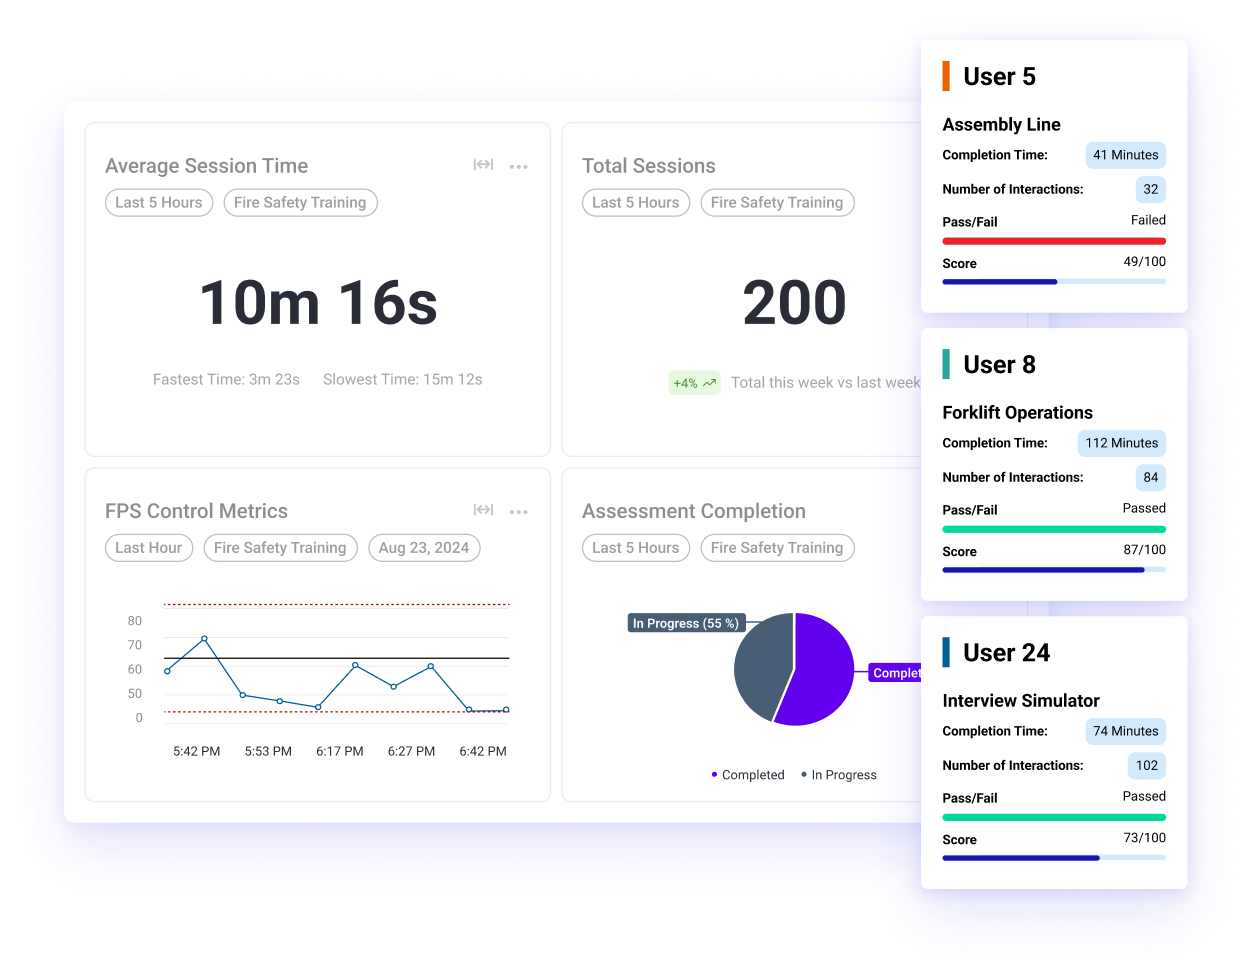
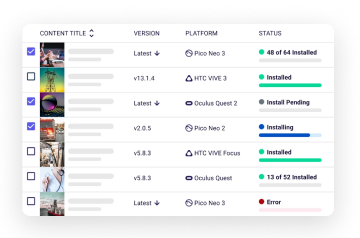
Track headset performance, pinpoint high-value experiences, monitor usage patterns like duration and frequency, and equip every team member with actionable insights to optimize training on the fly.

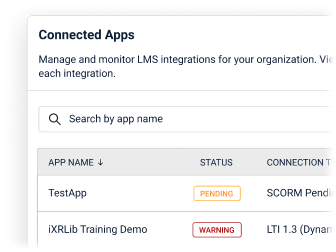
ArborXR Insights integrates with 500+ LMS and BI platforms automatically syncing XR learner data with your existing systems.

How It Works

1

Apply for Early Access

Submit a quick form and we’ll confirm eligibility within a few business days.

2

Guided Setup Call

Your dedicated ArborXR Specialist will walk you through setup to ensure everything is connected properly

3

Install SDK Into Your Developed Content

All it takes is 2 lines of code to start tracking data

4

Get Insightful Data

See your learning data in dashboards or LMS within minutes

Claim Your Early Access Spot

What You Can Do with ArborXR Insights

ArborXR Insights is the accelerator for your XR maturity, bridging immersive experiences with measurable business wins.

Claim Your Early Access Spot
Progress bars showing pass/fail percentages for three modules: Module 1 at 100%, Module 2 at 68%, and Module 3 at 50%.
User interface showing a list of content titles with version, platform icons, and installation status including installed, installing, install pending, and error states.

Instant Visibility Boost

Avoid Vendor Lock-in

Track every interaction and completion to close performance gaps and celebrate quick wins
ArborXR works with all content providers, internal builds, and custom experiences. Use it how you want by leveraging our API to get the data where it is needed to be accessed.
Interface showing connected apps with a search bar, listing TestApp with status Pending and iXRLib Training Demo with status Warning.

Easy Integrations

Bring VR Into Existing Learning Systems

Plug into your LMS ecosystem without developers, saving weeks of setup time.
Integrate with 500+ LMS and BI platforms in under 10 minutes.
Line graph showing FPS Control Metrics over time with data points fluctuating between 0 and 80 from 5:42 PM to 6:42 PM on August 23, 2025, tagged with Last Hour, Fire Safety Training, and User 23.

Outcome-Focused Scaling

Automated Data Capture

Generate reports that align XR with learning goals, securing budgets for growth.
Automatically track session activity and learner performance — no clipboards or manual observation.

The Learning Blind Spot in XR

When XR Training Data Stays Disconnected, Learning Suffers

Two factory workers wearing safety vests and helmets, one using a virtual reality headset and the other holding a clipboard and pen.

These roadblocks trip up even the savviest teams:

Red circle with a diagonal cross inside, indicating an error or cancellation.
Teams are misaligned on what metrics matter most
Red circle with a diagonal cross inside, indicating an error or cancellation.
It's tough to measure success with spreadsheets
Red circle with a diagonal cross inside, indicating an error or cancellation.
leadership buy-in is near impossible without clear, consolidated data.

You can’t improve what you can’t measure.
Most XR training programs don’t know if learners are completing sessions, retaining knowledge, or progressing over time. Without visibility, teams can’t scale what’s effective.

Gain Full Visibility into Learner Outcomes

Bring XR Training Into Your Learning Ecosystem

ArborXR Insights gives learning and development teams a clear view into learner progress, performance, and engagement.

Green check mark inside a circle indicating success or confirmation.
See where learners struggle so you can refine training before it scales.
Green check mark inside a circle indicating success or confirmation.
Identify which XR experiences drive participation and lasting retention.
Green check mark inside a circle indicating success or confirmation.
Share clear results to secure continued support for XR initiatives.

When you can measure learning, you can improve it.
With clear visibility into completion, retention, and progress, XR training teams can identify what’s working, refine what’s not, and confidently scale programs that make a lasting impact.

Claim Your Early Access Spot
Man wearing virtual reality headset manipulating a 3D mechanical design hologram in a modern office.
Person wearing VR headset and safety vest interacting with floating digital training performance charts in a gym-like environment.

"One of the biggest advantages of ArborXR Insights is how painless it is to integrate. The SDK and Library are straightforward and lightweight, making it easy to get started quickly."

Most VR Training Programs are Flying Blind Without the Data

Still not sure? In this 3-minute video, we cover:

  • The 4 biggest challenges holding back VR training programs
  • Why measuring real learner outcomes is so hard without analytics
  • How ArborXR Insights gives Fortune 500 companies complete clarity across their XR training ecosystem

With ArborXR Insights, you can:

Track session duration, completion rates, performance scores, and struggle points — in real time

  • Connect seamlessly with 500+ LMS, HR, and BI tools. No manual exports or data wrangling
  • Show measurable learner progress that earns leadership confidence
  • Deploy with enterprise-grade security (SOC 2 certified, trusted by 60+ Fortune 500s)
  • For developers: add analytics with just two lines of code
Claim Your Early Access Spot
White virtual reality headset with floating data charts showing pass/fail module scores, FPS control metrics, and bar chart statistics.